How MELT is Revolutionizing System Observability


Welcome to the daily challenge of modern SREs and production engineers. We’re the unsung guardians of the digital realm, tasked with keeping the invisible engines of the internet running smoothly. But fear not, fellow defenders of the digital domain! There’s a powerful ally in our quest for clarity – a force so potent, it’s like gaining X-ray vision, super hearing, and precognition all at once.
Enter the MELT Zone – a realm where the invisible becomes visible, where whispers of system hiccups become clear warnings, and where the chaos of countless moving parts transforms into a symphony of insights.
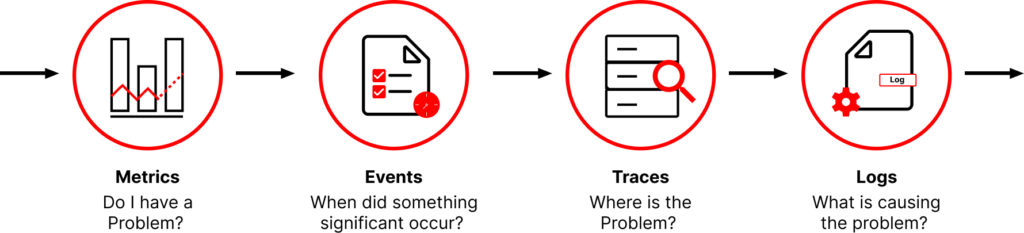
Curious? You should be. Because in the next few minutes, you’re about to discover how Metrics, Events, Logs, and Traces (MELT) can transform you from a stressed-out firefighter to a proactive digital mastermind. Buckle up, because we’re about to embark on a journey that will revolutionize the way you see (yes, actually see!) your systems.
Ready to melt away the fog of uncertainty and step into a world of crystal-clear observability? Let’s dive in!
Metrics: Quantifying System Health
Metrics, the vital signs of the Digital Systems.Metrics are quantifiable measurements collected regularly, offering insights into system health and performance.
Key metrics include:
-
- Request rate
- Error rate
- Response time
- CPU and memory usage
- Active users
- Transaction volume
- Data transfer volume
Implementing comprehensive metrics can lead to significant improvements in system performance. Organizations adopting detailed performance monitoring often identify and address major bottlenecks more quickly, potentially seeing substantial reductions in average response times and improvements in user satisfaction.
Real-world scenario: Google’s Site Reliability Engineering (SRE) Practices
Google’s SRE team famously uses a comprehensive set of metrics to maintain the reliability and performance of their systems. Their approach includes:
-
- Service Level Objectives (SLOs) for key metrics
- Error budgets to balance reliability and innovation
- Detailed latency measurements (including tail latencies)
- Automated alerting based on multi-window, multi-burn-rate alerts
By implementing these practices, Google has been able to:
-
- Maintain 99.99% uptime for critical services
- Rapidly identify and address performance bottlenecks
- Make data-driven decisions about infrastructure investments
- Foster a culture of continuous improvement in system reliability
This metrics-driven approach has become a model for many organizations seeking to improve their operational excellence and system reliability.
Reference: Beyer, B., Jones, C., Petoff, J., & Murphy, N. R. (2016). Site Reliability Engineering: How Google Runs Production Systems. O’Reilly Media.
Events: Capturing the Heartbeat of Your System
Events are discrete, timestamped records of noteworthy occurrences within your system. Unlike detailed logs, events focus on specific, impactful moments.
Key characteristics:
-
- Structured data format (often JSON)
- Contains timestamp and event type
- Includes relevant contextual information
- Lower volume than logs, but higher significance
Real-world scenario: Netflix’s Chaos Monkey Netflix famously uses its Chaos Monkey tool to randomly terminate instances in production. Each instance termination generates an event, allowing Netflix to:
-
- Track the frequency and impact of failures
- Measure system resilience
- Identify areas needing improvement in their auto-recovery processes
By analyzing these events over time, Netflix continuously enhances its ability to handle unexpected outages and maintain high availability.
Reference: Rosenthal, Casey, and Nora Jones. Chaos Engineering: System Resiliency in Practice. O’Reilly Media, 2020.
Logs: The Detailed Chronicle of Your System
Logs are the time-stamped chronicles of your system’s life, providing a granular view of application behavior. They’re your go-to resource for troubleshooting, auditing, and uncovering system patterns.
Key Log Categories:
-
- INFO: “User ‘alice’ logged in successfully”
- WARNING: “High CPU usage detected: 85%”
- ERROR: “Database connection timeout after 30 seconds”
- CRITICAL: “Payment gateway offline, unable to process transactions”
- DEBUG: “Function ‘calculateTax()’ called with parameters: base=100, rate=0.08”
Real-world scenario: Monzo Bank’s Logging Practice
Monzo, a UK-based digital bank, uses structured logging extensively. Their approach includes:
-
- Consistent log formats across services
- Automatic inclusion of request IDs for tracing
- Dynamic log levels for different environments
This strategy allowed Monzo to quickly identify and resolve critical issues where some customers were seeing incorrect balance information due to a caching problem.
Reference: Newman, Sam. Building Microservices. O’Reilly Media, 2015.
Example log entry (JSON format):
Traces: Illuminating the Journey of Requests
Traces are the digital breadcrumbs that reveal a request’s journey through your distributed system, offering crucial insights into complex transactions, especially in microservices architectures.
Key components:
-
- Trace ID: Unique identifier for the entire request lifecycle
- Span: Unit of work within the trace
- Tags: Key-value pairs providing context
- Timestamps: Start and end times for each span
Real-world scenario: Uber’s Distributed Tracing System
Uber developed its own tracing system called Jaeger to manage its complex microservices architecture. Jaeger helps Uber:
-
- Identify performance bottlenecks
- Troubleshoot errors across services
- Optimize service dependencies
In one instance, Uber used Jaeger to diagnose an issue where ride requests were timing out during peak hours. The traces revealed that a specific microservice was becoming a bottleneck due to inefficient database queries. After optimization, Uber saw a 70% reduction in request timeouts.
Reference: Shkuro, Y. (2019). Mastering Distributed Tracing: Analyzing Performance in Microservices and Complex Systems. Packt Publishing, Limited.
Embracing the MELT Revolution
We’ve journeyed through the MELT framework, witnessing how Metrics, Events, Logs, and Traces transform invisible digital landscapes into crystal-clear vistas. From Google’s 99.99% uptime to Uber’s 70% reduction in timeouts, the power of MELT is undeniable.
But this is just the beginning. As you implement MELT in your systems, remember: each component is a piece of a greater puzzle. Together, they form a complete picture that turns chaos into clarity, reactive firefighting into proactive mastery.
So, digital guardians, are you ready to step into the MELT zone? Your systems are calling, and a new era of observability awaits. It’s time to melt away the fog and see your digital world with superhero clarity. The future is observable – and it’s brighter than ever.
Related Articles

Related Articles
Established in 2012, Xgrid has a history of delivering a wide range of intelligent and secure cloud infrastructure, user interface and user experience solutions. Our strength lies in our team and its ability to deliver end-to-end solutions using cutting edge technologies.
NAVIGATE
Cloud & DevOps Web & Mobile Apps Temporal Digital Marketing GTM Engineering Marketo Consulting HubSpot Consulting Company Careers ResourcesOFFICE ADDRESS
US Address:
Plug and Play Tech Center, 440 N Wolfe Rd, Sunnyvale, CA 94085
Dubai Address:
Dubai Silicon Oasis, DDP, Building A1, Dubai, United Arab Emirates
Pakistan Address:
Xgrid Solutions (Private) Limited, Bldg 96, GCC-11, Civic Center, Gulberg Greens, Islamabad
Xgrid Solutions (Pvt) Ltd, Daftarkhwan (One), Building #254/1, Sector G, Phase 5, DHA, Lahore
Xgrid © 2026. All rights reserved.